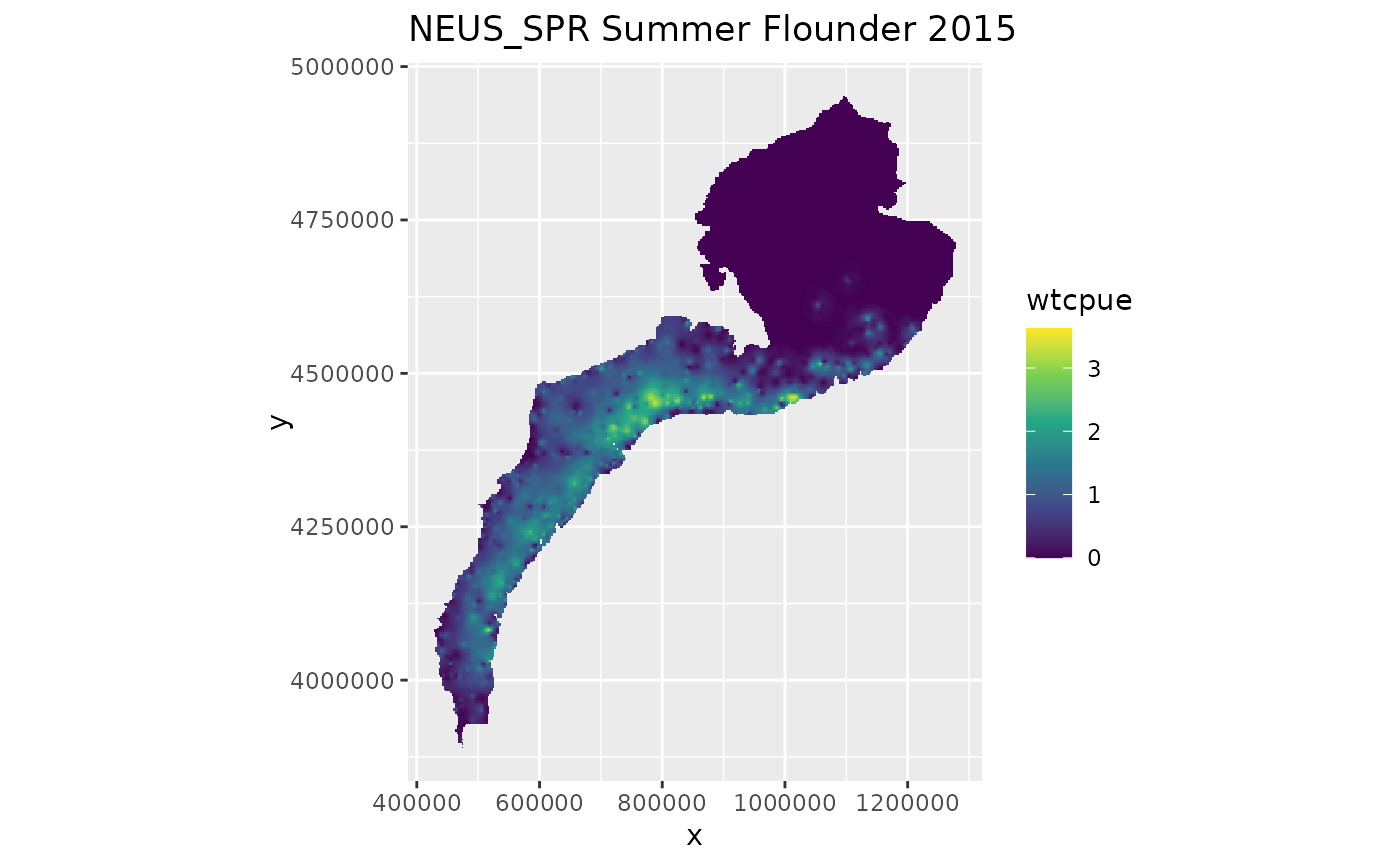
Creates a visualization of the raster data, either interactively or statically.
Usage
dm_plot_raster(
  r,
  interactive = TRUE,
  tiles = "Esri.OceanBasemap",
  main = NULL,
  var = NULL,
  title = NULL,
  fill_palette = ggplot2::scale_fill_viridis_c,
  ...
)
Arguments
- r
A SpatRaster object
- interactive
Whether to create an interactive plot (default: TRUE)
- tiles
Background tiles for interactive plot (default: "Esri.OceanBasemap")
- main
Map title for interactive plot (default: NULL)
- var
Variable name to plot in static plot (default: determined from raster)
- title
Plot title for static plot (default: NULL)
- fill_palette
Color palette function for static plot (default: scale_fill_viridis_c)
- ...
Additional arguments passed to plotting functions
Examples
# Get a raster for demonstration
dataset_code <- "NEUS_SPR"
layer <- "Paralichthys dentatus"
year <- 2015
r <- dm_get_raster(dataset_code, layer, year)

# Interactive plot
# Not run: dm_plot_raster(r, interactive = TRUE, main = paste(dataset_code, "Summer Flounder", year))

# Static plot
dm_plot_raster(r, interactive = FALSE, title = paste(dataset_code, "Summer Flounder", year))