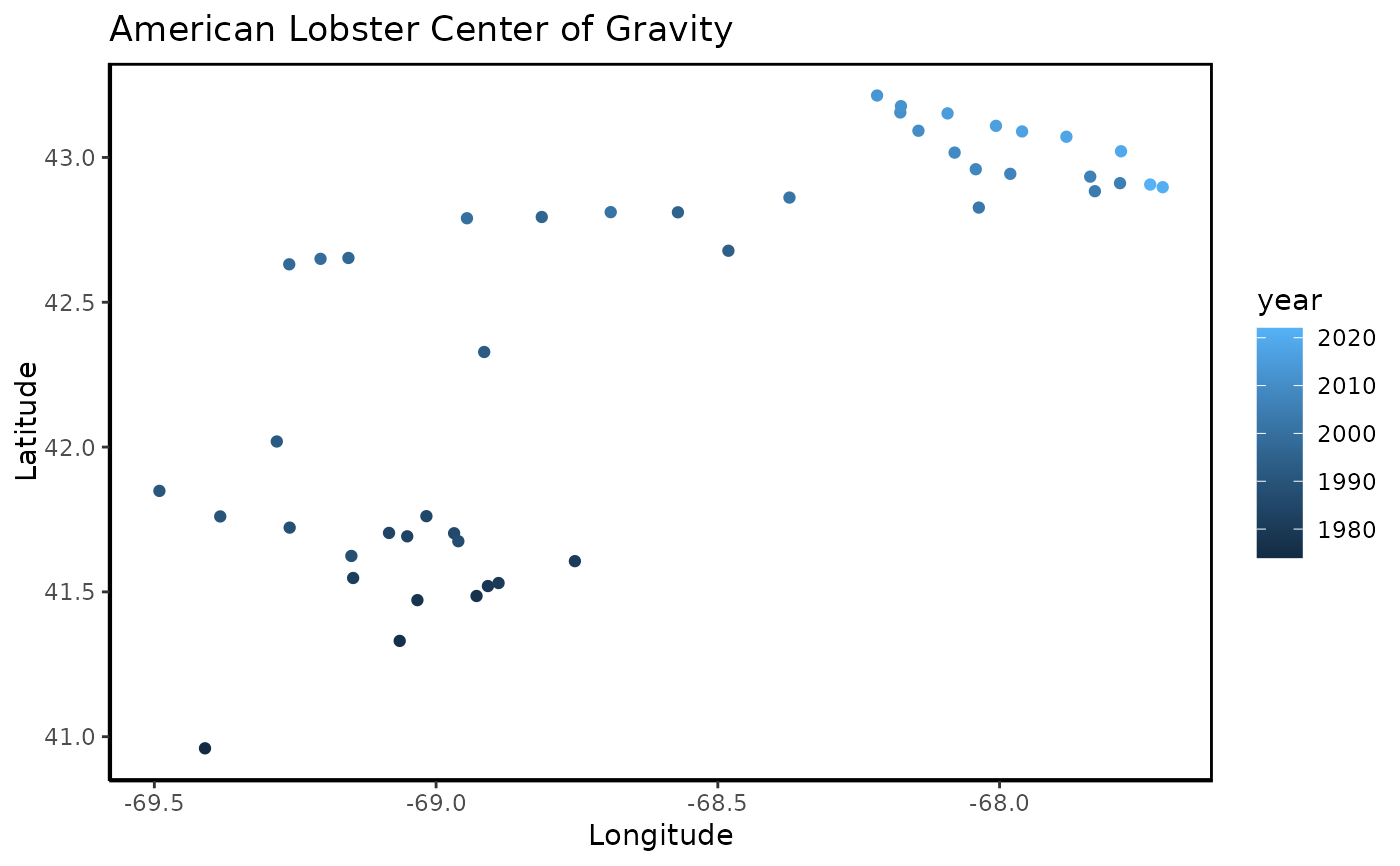
Creates a visualization of indicators data, including center of gravity changes over time for a species.
Usage
dm_plot_indicators(
  data,
  x = "center_of_gravity_longitude",
  y = "center_of_gravity_latitude",
  color = "year",
  title = "Indicators",
  ...
)
Arguments
- data
A data frame containing indicators data, typically from dm_get_indicators()
- x
Column name for longitude (default: "center_of_gravity_longitude")
- y
Column name for latitude (default: "center_of_gravity_latitude")
- color
Column name for color aesthetic (default: "year")
- title
Plot title (default: "Indicators")
- ...
Additional arguments passed to ggplot2 functions
Examples
tbl_lobster_indicators <- dm_get_indicators(
  common_name = "American lobster",
  region      = "Northeast US",
  season      = "Spring")
tbl_lobster_indicators
#> # A tibble: 46 × 27
#>    objectid dataset_code region       season date_code species       common_name
#>       <int> <chr>        <chr>        <chr>  <chr>     <chr>         <chr>
#>  1     9866 NEUS_SPR     Northeast US Spring 20240701  Homarus amer… American l…
#>  2     9867 NEUS_SPR     Northeast US Spring 20240701  Homarus amer… American l…
#>  3     9868 NEUS_SPR     Northeast US Spring 20240701  Homarus amer… American l…
#>  4     9869 NEUS_SPR     Northeast US Spring 20240701  Homarus amer… American l…
#>  5     9870 NEUS_SPR     Northeast US Spring 20240701  Homarus amer… American l…
#>  6     9871 NEUS_SPR     Northeast US Spring 20240701  Homarus amer… American l…
#>  7     9872 NEUS_SPR     Northeast US Spring 20240701  Homarus amer… American l…
#>  8     9873 NEUS_SPR     Northeast US Spring 20240701  Homarus amer… American l…
#>  9     9874 NEUS_SPR     Northeast US Spring 20240701  Homarus amer… American l…
#> 10     9875 NEUS_SPR     Northeast US Spring 20240701  Homarus amer… American l…
#> # ℹ 36 more rows
#> # ℹ 20 more variables: core_species <chr>, year <int>,
#> #   distribution_project_name <chr>, distribution_project_code <chr>,
#> #   summary_product <chr>, center_of_gravity_latitude <dbl>,
#> #   minimum_latitude <dbl>, maximum_latitude <dbl>, offset_latitude <dbl>,
#> #   center_of_gravity_latitude_se <dbl>, center_of_gravity_longitude <dbl>,
#> #   minimum_longitude <dbl>, maximum_longitude <dbl>, offset_longitude <dbl>, …

# plot center of gravity changes over time
dm_plot_indicators(
  tbl_lobster_indicators,
  title = "American Lobster Center of Gravity")