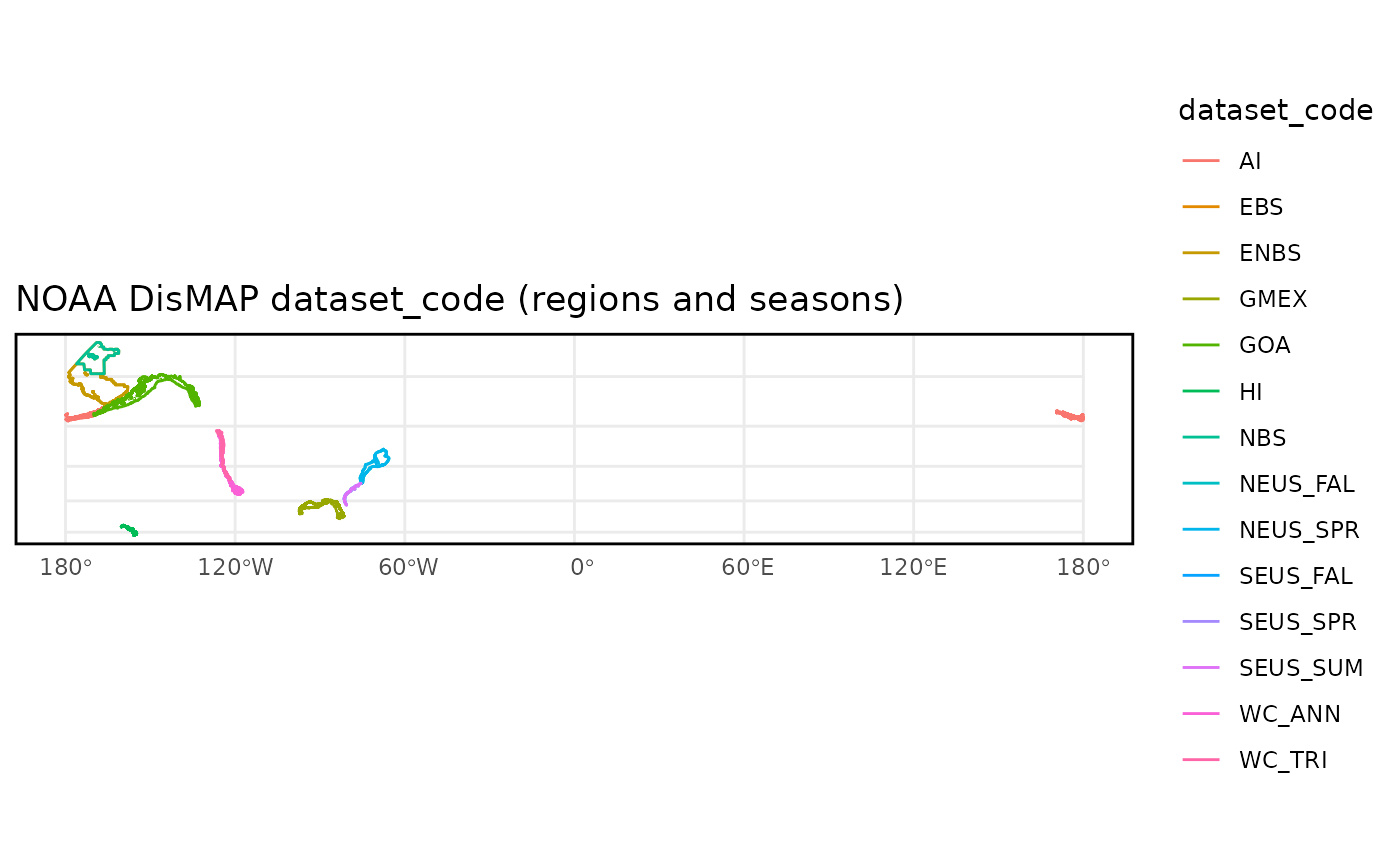
Creates a ggplot to visualize the spatial datasets available in DisMAP.
Usage
dm_plot_datasets(
  data,
  color = "dataset_code",
  title = "NOAA DisMAP dataset_code (regions and seasons)",
  ...
)Examples
# show table of dataset_codes for available regions and seasons
dm_datasets |>
  sf::st_drop_geometry() |>
  head()
#> # A tibble: 6 × 4
#>   dataset_code region                          season distribution_project_code
#>   <chr>        <chr>                           <chr>  <chr>
#> 1 AI           Aleutian Islands                ""     IDW
#> 2 EBS          Eastern Bering Sea              ""     IDW
#> 3 ENBS         Eastern and Northern Bering Sea ""     IDW
#> 4 GMEX         Gulf of Mexico                  ""     IDW
#> 5 GOA          Gulf of Alaska                  ""     IDW
#> 6 HI           Hawai'i Islands                 ""     IDW

# show map of dataset_codes
dm_plot_datasets(dm_datasets)